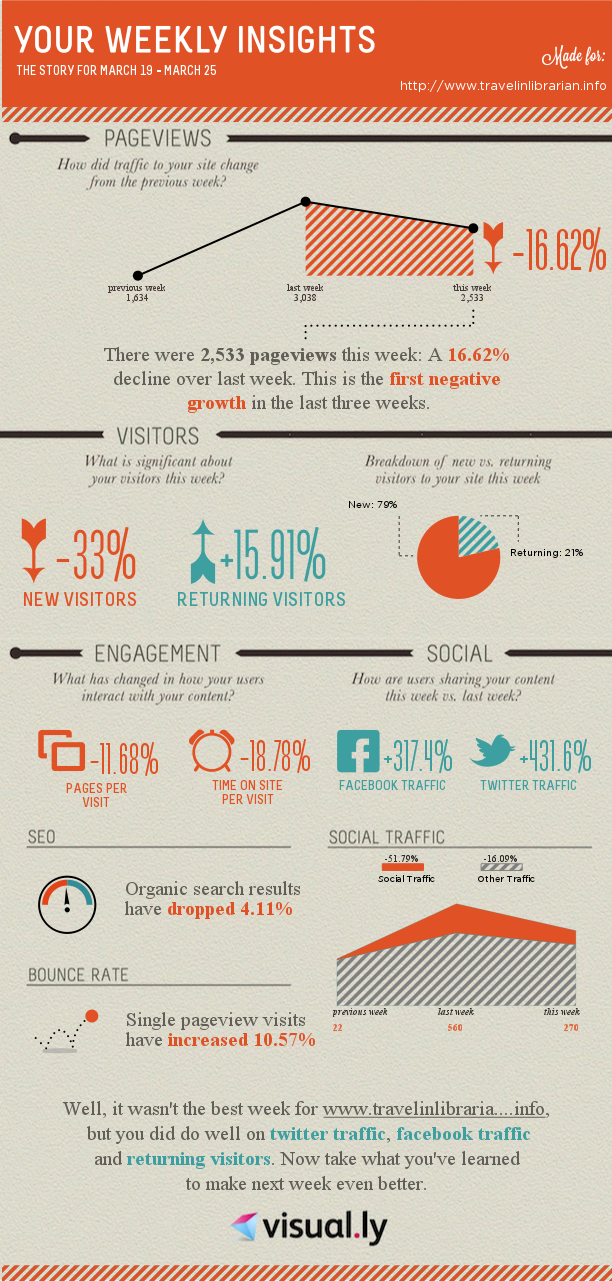
The visual.ly service now has a service to create an infographic based on your site’s Google Analytics. Once you’ve created the first one you have the ability to have a new one e-mailed to you once a week. Here’s the first one I just created as an example.
Michael Sauers is the Director of Logan Library in Logan, UT. Prior to this he was one of the founding staff and Technology Manager for Do Space in Omaha, NE. After earning his MLS in 1995 from the University at Albany's School of Information Science and Policy Michael spent his first 20 years as a librarian training other librarians in technology along with time as a public library trustee, a bookstore manager for a library friends group, a reference librarian, a technology consultant, and a bookseller. He has written dozens of articles for various journals and magazines and has published 14 books ranging from library technology, blogging, Web design, and an index to a popular horror magazine. In his spare time, he blogs at TravelinLibrarian.info, runs The Collector's Guide to Dean Koontz website at CollectingKoontz.com, takes many, many photos, and typically reads more than 100 books a year.
Unless otherwise stated, all opinions are my own and are not to be considered those of the City of Logan, UT.
View all posts by Michael Sauers
One Reply to “Google Analytics infographic”