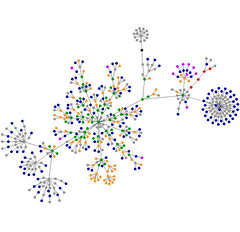
Check this out. Websites as graphs [URL expired] takes in your URL and visualizes your site. This one’s mine. There’s also a flickr tag (websitesasgraphs) so you can see other results.
Legend:
blue: for links (the A tag)
red: for tables (TABLE, TR and TD tags)
green: for the DIV tag
violet: for images (the IMG tag)
yellow: for forms (FORM, INPUT, TEXTAREA, SELECT and OPTION tags)
orange: for linebreaks and blockquotes (BR, P, and BLOCKQUOTE tags)
black: the HTML tag, the root node
gray: all other tags
What I’m trying to figure out is what four pages on my site include tables…
Thanks Darlene (but I can’t get a link to your blog to work…)
Michael Sauers is the Director of Logan Library in Logan, UT. Prior to this he was one of the founding staff and Technology Manager for Do Space in Omaha, NE. After earning his MLS in 1995 from the University at Albany's School of Information Science and Policy Michael spent his first 20 years as a librarian training other librarians in technology along with time as a public library trustee, a bookstore manager for a library friends group, a reference librarian, a technology consultant, and a bookseller. He has written dozens of articles for various journals and magazines and has published 14 books ranging from library technology, blogging, Web design, and an index to a popular horror magazine. In his spare time, he blogs at TravelinLibrarian.info, runs The Collector's Guide to Dean Koontz website at CollectingKoontz.com, takes many, many photos, and typically reads more than 100 books a year.
Unless otherwise stated, all opinions are my own and are not to be considered those of the City of Logan, UT.
View all posts by Michael Sauers